Monday, November 30, 2015

Astrological explanations of the Santa Claus rally

(30 November 2015) As we begin the month of December, investors are anticipating the greater likelihood of improved stock market returns due to the traditional Santa Claus rally.  Research on seasonal variation in returns has shown that December tends to outperform most other months of the year in US markets.  In particular, the week between Christmas and New Year's tends to be most bullish as stocks have posted an average gain of 1.5% in that short five-day period. Nobody knows exactly why stocks tend to rise in December although several plausible theories have been suggested including holiday optimism, reduced trading volumes and year-end accounting and tax considerations.

I would also offer an astrological explanation for the relative buoyancy of stocks during December, particularly the second half.  That is: the Sun transits through sidereal Sagittarius between December 15 and January 13 (+/- 1 day).  The reason why the Sun's transit of Sagittarius should tend to be positive is that according to astrological tradition, Sagittarius is said to be "ruled" by the planet Jupiter. Jupiter is the quintessential bullish planet that symbolizes expansion, optimism and growth.  When the Sun makes its 30-day transit through its sign, some of that optimistic Jupiter energy is more likely to manifest in the world. Naturally, this includes the stock market which is nothing if not an ongoing barometer of collective human sentiment.

And it is worth noting that this phenomenon is much less apparent in the Western tropical zodiac whereby the Sun transits tropical Sagittarius between November 22 and December 22.  Instead, it is the sidereal zodiac that is widely used in India that seems to reflect this clearer symbolism of optimistic Jupiter-ruled Sagittarius.


Year Sun enters Sagittarius
Sun exits Sagittarius
% change
2015-2016 Dec 16 Jan 14 ???
2014-2015 " " +1
2013-2014 " " +3
2012-2013 " " +4
2011-2012 " " +6
2010-2011 " " +4
2009-2010 " " +3


From the table, we can see how US stocks rose in each of the past five transits of the Sun through Sagittarius.   The gains are consistent and significantly large.  To be sure, we have seen a bull market since 2009 so it stands to reason that most months or 30-day time periods would be positive.  Without getting into highly technical statistical analysis, I would still suggest that the mid-Dec to mid-Jan gains still outpaces the annual averages.  Interestingly, February returns are well below the monthly average and are actually negative.  This also confirms astrological assumptions since the Sun transits through Saturn-ruled signs Capricorn and Aquarius during the month of February.  Saturn, of course, is a bearish influence and is considered to be the planet of contraction, pessimism and negativity. 


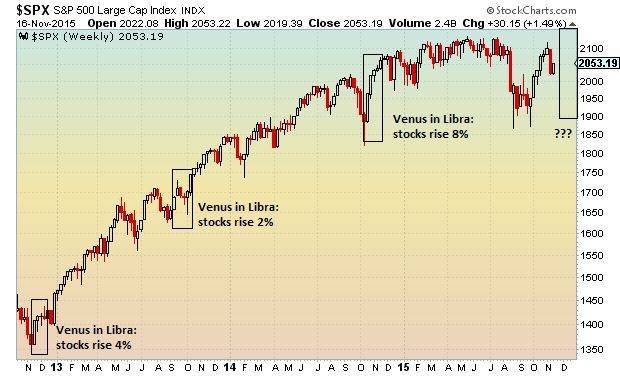
So what can we expect for this year's version of the Santa Claus rally in December?  As I noted previously, the transit of Venus through Libra from today (Nov 30th) until Dec 24 is a more positive influence.  Besides the transit effect of the Sun through Sagittarius beginning Dec 15th, the odds also favor some upside due to this Venus in Libra effect.  After the 24th, however, it could be more difficult to stocks to rise.  While the Sun will continue its transit in Sagittarius, the loss of the boost from Venus may cause some problems.  Somehow I think the Santa Claus rally will not quite play out as expected this year.  Perhaps if gains are significant enough before the 24th, then stocks may end up more neutral.  We shall see. 


Weekly Market Forecast


Stocks were generally mixed last week as fears over a slowing economy were offset somewhat by the acceptance of a December interest rate hike by the Federal Reserve.  US stocks were mostly flat while European and Indian markets posted a modest gains.  As expected, the month of November ended modestly lower which was in keeping with the bearish influence of the Venus transit of Virgo.  This year's decline makes it six consecutive negative outcomes for the four-week transit of Venus in Virgo since 2009.  The low actually occurred in the middle of the month and we have seen a rebound higher since then. 

This week will be an opportunity to see the effects of the sign change of transiting Venus.  Its entry into Libra today (Nov 30th) increases the likelihood of gains somewhat although it is not as robust a correlation as the Venus in Virgo transit.  Nonetheless, this week leans bullish in any event given the late week Mercury-Jupiter alignment.   If there is a negative day here, Wednesday could be more susceptible to declines in the US, while Tuesday looks somewhat problematic for India.

Monday, November 16, 2015

Venus enters sidereal Libra on 30th November: research on financial astrology

(16 November 2015)  So far, so Virgo.  Or more precisely, Venus in Virgo.  Ever since Venus began its transit of sidereal Virgo on 3rd November, most global stock markets have fallen.  In some cases, such as in the US and Europe, the entry date came very close to the interim high whereas other markets such as India's has seen declines that began in October extended further. 

In any event, the bearish influence of the transit of Venus in Virgo appears to be confirmed yet again.  As I have shown in a previous stock market analysis, recent incidents of this once-a-year transit have correlated with declines.  The four-week-long transit of Venus in Virgo has correlated with declines in each of the last six years.  The astrological reasoning is fairly simple: Venus is seen as the planet of money and value and traditionally it is said to do poorly in Virgo, which is considered its sign of debilitation.  Amazingly, this very basic one-factor model of stock market movements has generally outweighed most other planetary factors.  

As stocks rose today (Monday), we still have two weeks to go in this transit of Virgo so we cannot rule out a rebound in stocks towards the end of the month.  But so far, it is looking like the overall 27-day bearish influence of Venus in Virgo will hold for another year.

But what happens when Venus leaves Virgo and enters Libra on 30th November?   According to astrological tradition, Venus is said to "rule" the sign of Libra.  There is a general affinity between the symbolism of the planet Venus and the sign of Libra: amity, sociality, optimism, diplomacy.  From a purely deductive point of view, one would think that Venus would do well in Libra.  Since financial astrology places a special importance on Venus through its rulership over notions of value, there is some reason to expect stocks would generally rise during its four-week transit of Libra.  Let's see what the recent data of this transit suggests.


Venus in Libra


In the chart above and table below, we find good evidence that the transit of Venus in Libra is in fact bullish for US stocks.   I would expect this relationship to generally hold for other national markets although the strength of the correlation may be somewhat different.   Obviously, this is a very small dataset so I am not making any definitive truth claims here.  But it is an interesting observation nonetheless.  On several occasions, the actual day of the entry of Venus into sidereal Libra correlated with a very large gains in stocks.  This happened most famously in 2010 on September 1st and the Ben Bernanke speech at Jackson Hole that argued for more quantitative easing (QE).  It also occurred on 2011 on October 4th immediately after the market bottomed following the US debt default crisis that year. 

Please note that I am referring to sidereal Libra as used in India and not tropical Libra as used more commonly in the West.  There is now a 24 degree difference between zodiacs which complicates this question about the effects of sign transits of different planets.


MARKET EFFECTS OF VENUS TRANSITS OF LIBRA
Year Venus entry date Venus exit date Market outcome - DOW
2007 November 29 December 24 +2%
2008 September 19 October 13 -16%
2009 November 3 November 26  +6%
2010 September 1 October 7 +20%
2011 October 4 October 27 +7%
2012 November 17 December 10 +4%
2013 September 6 October 1 +2%
2014 October 19 November 11 +8%
2015 November 30 December 24 ???


We should note a rather glaring anomaly, however.  Stocks plunged 16% in 2008 during that year's Venus transit of Libra.  This was part of the larger financial meltdown brought about by the US mortgage crisis.  How are we to make sense of this?  I would say it is an obvious outlier, since there were several other strongly bearish alignments in play at that time.  The alignments were so strongly bearish that I made mention of them several times on my blog and website back in 2008.  The chances that stocks would rise during that period were very small despite the apparently bullish transit of Venus in Libra.  Just as in economics, astrology has to contend with a multiplicity of factors which have to be assessed for their impact on the ultimate outcome.  In 2008, I did not expect the transit of Venus in Libra to have much bullish effect at all in light of the overwhelmingly negative alignment of Saturn, Rahu and Neptune.

But if 2008 is an outlier, then what is the likelihood that the 2015 Venus transit of Libra will produce higher stock prices?  Since the Saturn-Neptune square will be separating and hence, weakening through the course of the 2015 transit in December, I would think the chances are good that stocks will rise during the course of this transit.  This is not a certainty, of course, but rather an educated guess based on the previous track record of this transit.  I offer more details on this question in my weekly subscriber newsletter.


Weekly Market Forecast

Markets were mostly lower last week as investors pondered the implications of a possible Fed rate hike in December.   Monday trading was higher across the board despite the Paris terror attacks.   I had been fairly bearish in last week's market forecast given the Mars-Rahu conjunction.  Thursday in particular was bearish on the Moon-Saturn alignment, although the Sun-Jupiter failed to boost stocks much at all. 

The clouds remain in place this week as both Mercury and the Sun align with Ketu (South Node) into midweek.  Wednesday and Thursday look more bearish in this respect so any gains we might have seen in the early going this week could be vulnerable to these later moves.

Monday, November 9, 2015

Gold falls further: more evidence for financial astrology

(9 November 2015) The steep sell-off in gold last week was a nice confirmation of the inner workings of financial astrology.  Despite the unquestionable beauty of this Gustav Klimt painting, Gold plunged 4% on the week closing below $1100 for the first time since August.  In last week's post, I thought the chances were good that gold would decline given the difficult situation of the planet of Venus.  

Venus is one of the main planetary significators for the price of gold (along with women and art, of course!) and when it is under pressure gold typically declines.  I had noted that Venus entered its sidereal sign of debilitation on Tuesday November 3rd.  This sign transit of Virgo lasts four weeks and is often a bearish indicator.  To top it off, Venus also conjoined Mars just the day before and was still minutes of arc past its exact conjunction.  As a malefic planet, the proximity of Mars to Venus is also a factor that often depresses gold as my investigation of previous Venus-Mars conjunctions showed fairly clearly.  As a consequence of this alignment, gold fell sharply on Tuesday as it broke a key technical support level.

Another angle on the collapse of gold prices can be seen through the a key natal horoscope for the yellow metal.  Gold's first publicly traded price was established among London gold dealers on September 12, 1919.  This chart has repeatedly provided strong indications of the ups and downs of gold prices.  As a rule, close aspects involving Saturn or the Nodes (Rahu and Ketu) correspond with declines while Jupiter aspects are more bullish.  Of course, not all aspects are created equal so it is a matter of some interpretation to determine which aspect will prevail.  On the whole, Saturn aspects outweigh Jupiter aspects.  This may be an artifact of Saturn's slower velocity, although it may just be a feature of Saturn itself. 


The current situation is clear enough: transiting Saturn (10 Scorpio) is approaching its square aspect with Neptune (13 Aquarius) in the coming weeks.  This is a negative influence although not necessarily specific to gold.  But the real problem is that the Saturn-Neptune is aligning very closely with the natal Mercury-Saturn conjunction at 11-12 Leo.  That is specific to gold.  Even worse, Saturn will be aligning with the 2nd equal house cusp (12 Scorpio) and therefore it will be afflicting the 11th equal house cusp almost exactly throughout the month of November.  The 2nd house is associated with wealth while 11th house is connected with gains -- a double whammy on these "money houses".  Therefore, this close Saturn square aspect makes further declines more likely. 

The reason why gold took such a nosedive last week is that the Venus-Mars-Rahu conjunction in Virgo was in the 12th house (of loss!) and in close trine aspect with natal Ketu (5 Taurus).  Ketu is another first-rate malefic (along with Saturn and Mars) so any transit interaction with natal Ketu in this chart is likely to correlate with declines.  The whole week was negative with another large decline on Friday just as the Venus and Mars were moving into a near-exact 120-degree trine aspect with Ketu.  So between this obvious natal situation in the 1919 chart and the difficulty of Venus going into Virgo with Mars in tow, the probability of a significant decline was very high indeed last week.

Of course, Jupiter is also in the picture here as it approaches its conjunction with natal Sun and Venus in Leo.  This is likely to produce some upside in gold over the next couple of months as Jupiter turns retrograde at 29 Leo in early January, just a few degrees past the Sun-Venus pairing.  But I would think that the Saturn-Neptune square has to move away first, which may be felt only after the end of the November when the aspect begins to separate. 


Weekly Market Forecast

While gold slumped against the rising US Dollar, stocks were more mixed last week.  US markets were fairly flat while Indian stocks suffered a more significant tumble.  In last week's market forecast, I thought we would get some downside last week given the placements of Mars and Saturn.   As expected, Wednesday and Thursday were generally lower.

Stocks extended their declines today (Monday) as Mars conjoined Rahu (North Lunar Node).   We may well see further downside this week from this malefic pairing although I would expect some upside likely on either Tuesday or Wednesday as the Sun aligns with Jupiter. Thursday's Moon-Saturn conjunction could undermine some of this optimism, however. 


Monday, November 2, 2015

Predicting the price of gold with the Venus-Mars conjunction

(2 November 2015)  It's not a good time to be a gold bug these days.  After peaking in 2011 above $1900, gold has since fallen 40% and shows few signs of returning to those lofty levels.  Not even recent strong hints from the European Central Bank (ECB) that it will begin a new round of QE managed to do much for the yellow metal.  With official inflation still below 2% in most developed economies, there is less need for the safe haven as a traditional storehouse of value.  While recent currency volatility has made gold somewhat more attractive to investors in emerging markets and other commodity-based economies, its value as measured in US Dollars remains low.  Gold took it on the chin again today as it declined $8 closing at $1133. 

As I have noted in previous posts, there are many astrological factors to consider when accounting for fluctuations in the price of gold.  Certain horoscopes figure prominently such as the chart for the first London gold fix in 1919 and the chart of the first US futures trade in 1974.  There are also any number of simple transit influences on gold.  Financial astrology typically relates the condition of the Sun and Venus to gold prices.  The Sun symbolizes government and historically a nation's currency was expressed in terms of gold and silver.  Venus enjoys a special affinity to gold because it is seen as representing value and luxuries. As a planet of abundance and expansion, Jupiter is also associated with gold.  Jupiter's connection with gold may be as a result of its symbolism of growth expectations and inflation, both of which are closely tied to gold prices.  The more expansionary an economy, the greater the inflationary pressures and hence the likelihood that gold will increase in value. 

This week I thought I would examine one simple planetary pairing and its apparent correlation with gold prices -- Venus and Mars.  I would argue that when Venus is strong and well-aspected, gold is more likely to rise.  Venus is said to be strong when it is transiting one of its own signs like sidereal Libra or Taurus, or its sign of exaltation, Pisces.  A well-aspected Venus would be one that is under the influence of Jupiter or perhaps Rahu (North Lunar Node).  Uranus, Neptune and Pluto may also be positive for gold prices if they form soft aspects with Venus.  But when Venus is afflicted by malefics like Saturn or Mars, we should expect the price of gold to come under pressure. 


This is exactly the situation in recent days as Venus has conjoined Mars in the last degree of Leo.  The exactly conjunction takes place today and tomorrow (November 2-3).  Due to the retrograde cycle of Venus, this is the third Venus-Mars conjunction this year.  In years when Venus is not retrograde, there is only one period of conjunction which lasts about 40 days.  Rather than narrowing down the exact conjunction to a single day, I like to think of it as conjunction window -- a period of about 40 days on average where Venus and Mars are separated by less than 10 degrees of longitudinal arc in the sky.  If neither planet is retrograde, this means that the faster-moving Venus will approach its conjunction with Mars for about 20 days and then gradually separate from Mars over the next 20 days.  This 10-degree conjunction window can vary substantially when either planet is retrograde. 

The previous Venus-Mars conjunction took placed in August and September in sidereal Cancer and Leo.  When retrograde Venus came to within 10 degrees of Mars on August 22nd, gold traded at $1159.  By the time Venus formed an exact conjunction on August 31st, gold had fallen to $1133.  When Venus was 5 degrees past Mars on September 7th, gold fell further to $1120. 

As a complicating factor, Venus ended its retrograde cycle on September 6th and began to move forward again.  This meant that Venus started to approach a conjunction with Mars again and was never located fully 10 degrees away.  At its furthest angular separation of 9.5 degrees in late September, gold prices recovered somewhat to $1145.  This was still lower than the $1159 at the beginning of the conjunction window but much less so than at the time of the end of the retrograde cycle.  So we can say that this retrograde cycle and unusually long period within the 10 degree conjunction window puts an asterisk next to this particular Venus-Mars conjunction.

Actually, we are still in that same unusually long Venus-Mars conjunction window that has been active in August 22nd.  For illustrative purposes, I have separated them in the chart and table below but the conjunction is still ongoing.  Venus will finally move out of range in late November. 


Before that, Venus conjoined Mars in early 2015.  When Venus approached Mars to within 10 degrees on January 31st, gold traded at $1283.  By the time of its exact conjunction on February 22nd, gold had fallen to $1201. On the day that Venus was separating by 10 degrees on March 15, gold had tumbled further to $1153.  This was a strong correlation that lasted well past the exact conjunction.  The standard astrological assumption is that the affliction by a malefic planet like Mars is greatest on the day of the exact conjunction.  As noted above, however, we know that this is only one factor out of many to consider.  The apparent negative correlation between price and the angular separation of Venus and Mars may manifest well past conjunction in some instances.

The chart below lists the dates and price correlations the last five Venus-Mars conjunctions.  N.B. There were no conjunctions in 2012 or 2014.


    Year          angular separation           Date           Gold Price  
   2011           -10     May 2       $1577
              0     May 22       $1508
           +10     June 12       $1529
        Net Change -4%
       
   2013             -10       March 16       $1604
               0       April 7       $1573
             +10       April 27       $1462
        Net Change -8%
       
   2015             -10       Jan 31        $1283
                0       Feb 22        $1201
              +10      March 15        $1153
        Net Change -10%
       
   2015           -10      Aug 22       $1159
              0      Aug 31       $1133
             +10*      *Sep 25       $1145
       *only 9.5 degrees     Net Change -1%
       
             -5       Oct 21      $1166
              0       Nov 2      $1133
             +10      Nov 23       ???


While this correlation looks fairly solid, it doesn't always hold.  In late summer 2010, gold prices actually rose sharply during a Venus-Mars conjunction.  This anomalous result does not necessarily invalidate the effect of Venus-Mars conjunctions on gold but merely reminds us that it is one factor among many.  It may not even be the most important factor at any given time.  In 2010, I would note that Venus was stronger than normal because it was transiting Libra, a sign it rules and does well in.  So that was one mitigating factor to reduce the negative effects of Mars.  Also, there was a very close conjunction of Jupiter with Uranus at that time.  This was likely bullish for inflation expectations and hence gold prices were more likely to rise, Venus-Mars notwithstanding. 

So what will happen to the price of gold over the rest of the current conjunction window?  By tomorrow, the Venus-Mars conjunction will be in the first degree of Virgo.  Venus is said to be debilitated in Virgo so that may be an added burden for gold besides whatever effects Mars may exert.  The conjunction window will end on November 23rd so it seems fairly likely that we will see gold fall below its current levels at some time between now and then.  However, it doesn't mean that it will be at its lowest point at the end of the window.  The low could come well below that end date, and indeed even after it as well.  The 10-degree window should only be seen as an approximate guide to the assessing the influence of this pairing. 


Weekly Market Forecast

Stocks were generally mixed last week as investors digested the latest indication from the US Federal Reserve that a December rate hike may be forthcoming.  US stocks held steady as the Dow ended fractionally higher on the week at 17,663.  Emerging markets such as India sold off as the Sensex lost 3% closing at 26,656.  In last week's market forecast, I thought that the market would likely move lower on the various Saturn influences.  Tuesday and Thursday were indeed lower in the US and the selling continued into Friday in other markets after the Fed announcement.

This week has so far started on a positive note in the US, although Asia was more bearish on Monday.   Tuesday's Venus-Mars conjunction in Virgo increases the probability of some downside in the days ahead although it may not occur immediately.  Wednesday and Thursday may be more problematic in this respect given the Moon-Saturn aspect that pervades both of those days.  Overall, I think the planets are leaning bearish.  As I have written previously, this transit of Venus through sidereal Virgo over the next four weeks is usually negative for stocks.