 (3 May 2017)
Conventional wisdom is that the stock market is the best place to put
your money for the long term. While periods of volatility can cause
some sleepless nights, it is hard to argue with the basic premise that
stocks do better in the long run than most other assets like bonds,
cash, or even gold. A case in point is the NASDAQ, the US-based
technology index. If you had invested just $100 at the time of its
inception in 1971, your investment would have increased 60-fold as the
NASDAQ is now trading at a record high above 6000. Even adjusted for
inflation, the investment has grown impressively by 10 times over that
46-year period, which amounts to a 5% return compounded annually.
That's definitely way better than holding cash when you think about what
$100 would have bought back in early 70s.
 But just how long is the long term? It you had been unlucky enough to have bought a basket of tech stocks in 2000 at the very top of the tech bubble, your investment would only have begun to show profit in 2016 in what would certainly have been a long and painful exercise in investor patience. Actually, when corrected for inflation that ill-timed investment in 2000 would still be down 10%. Similarly, money invested the stock market in 1929 before the crash would have taken at least 25 years to have shown a positive return. Clearly, the long term is sometimes a very long time indeed.
And this is why many investors try to time markets. As difficult and stressful as timing the market may be, there may be some ways which can simplify the process. Economist Robert Shiller's CAPE Index (Cyclically Adjusted Price Earnings Ratio) has attempted to identify periods when stocks will tend to do better. As stocks become more expensive relative to corporate earnings, the implied return of stocks goes down. As the chart shows, as the CAPE Index strays too far above its historical mean of 17, the average annual return of stocks falls. It is currently at a very lofty 29.5 which is one of the highest readings in recent history. Only the 2000 tech bubble and the peak of the 1929 market have been higher. According to Shiller's model, the implied return of stocks is now actually negative (-1.7%). In other words, Shiller's CAPE Index argues against investing in the market for the long term at this time as returns will likely be negative until the CAPE moves closer to its historical mean. This can be achieved either through an increase in corporate earnings or through a stock market decline.
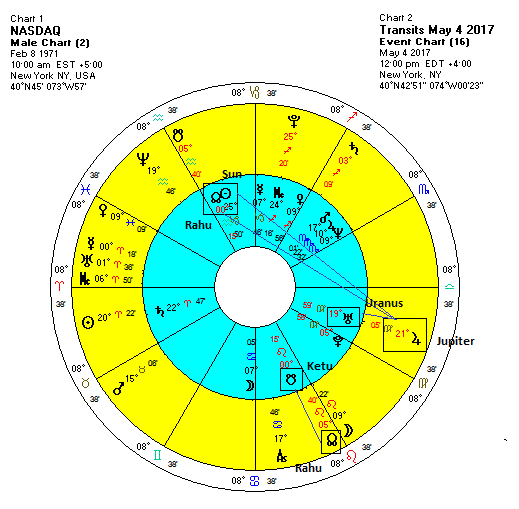
Astrology offers its own unique perspective on the question of market timing. There are many timing techniques we can consider in an astrological analysis. Dasha periods are often helpful in forecasting trends although they are sometimes unclear. Currently, the NASDAQ chart (Feb 8, 1971 10.00 a.m.) is running the Venus-Rahu period. Venus is a benefic planet and its period began in the depths of the 2008 meltdown. Stocks have rebounded strongly since then so that is an argument for its bullish influence. Rahu is more of a question mark as it is malefic in nature although it tends to do well in the 11th house as it is here. The Venus-Rahu period began in November 2015 and will run until November 2018. The period has certainly been bullish thus far, but Rahu is an unreliable indicator due to its changeable nature.
Transits may a more reliable predictive technique. The current rally in the NASDAQ may be a reflection of the Jupiter retrograde station at 29 Virgo which closely aspected the dasha minor lord Rahu in February. Transiting Jupiter has since aspected the Sun (also bullish) and will end its retrograde cycle in close conjunction with Uranus on June 9th. While further gains are possible around this Jupiter-Uranus conjunction in June, it is important to remember that trends are the result of the interplay of all planets, especially the slower moving planets such as Jupiter, Saturn, and the Lunar Nodes, Rahu and Ketu. Jupiter's bullish influence may therefore come under increased pressure as the nodal opposition of Ketu-Rahu gradually tightens in the weeks ahead.

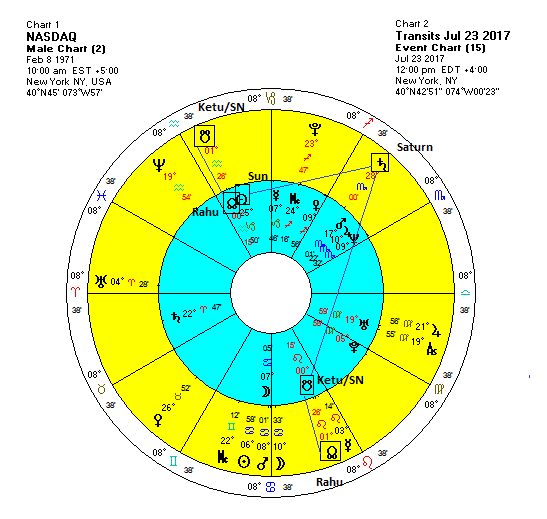
In addition to the nodal opposition in the natal chart, there will be a significant alignment of two malefics, Saturn and Rahu, this summer. Moreover, the alignment will last much longer than usual due to the retrograde motion of Saturn. And even more telling will be the fact that the Saturn-Rahu alignment will likely activate the natal Rahu in the NASDAQ horoscope at 0 Aquarius. The nodal opposition and conjunction is often bearish as it was in the spring of 2008 when Rahu conjoined its natal position in the midst of the year-long bear market. The Ketu-to-Rahu conjunction can also be problematic, especially if the dasha of one of the nodes is running as will be the case this summer during Venus-Rahu.
Saturn is due to station in late August at 27 Scorpio and will thus simultaneously cast a third house aspect to the natal Sun (25 Capricorn) and also come under the influence of natal Ketu (0 Leo). Due to the slow velocity of Saturn this summer, these aspects will be within range for a month on either side of the actual station on August 25th and possibly longer. Both aspects should be considered negative for market sentiment.

Jupiter's entry into Libra in September could be more positive since it aspects both Rahu and the Ascendant. This could produce another significant rally in the late fall and early winter. It is difficult to tell if this possible fourth quarter rally will be strong enough to offset any potential summer decline and produce higher highs.
Whatever the Q4 uncertainties, the bottom line is 2017 is shaping up to have its fair share of market turbulence. The higher probability of a correction reduces the likelihood of net gains for the year. Along with Shiller's CAPE Index, the planets offer more evidence that returns in the stock market are likely to be less than their historical mean and that a negative annual return is also a possible risk.
Weekly Market Forecast
Stocks have been somewhat flat since my post last week. The Dow continues to trade just below its all-time high at 21,000 while India's Sensex can't quite crack the elusive 30,000 barrier. It has actually pulled back a bit in recent days. I thought we might have seen some gains early this week around the Mercury-Uranus conjunction but gains have been tiny in the US. Wednesday's Fed statement more or less guaranteed the next rate hike for June but that did little to dampen the mood.
Mercury returned to direct motion today (Wednesday) so we could see some changes in outlook in the coming days. Mercury is still conjunct Uranus for the rest of the week so more upside would not be surprising. And yet its forward motion will soon put in into alignment with bearish Saturn. That somewhat increases the likelihood of declines on Thursday, Friday and even into early next week.
For more details and analysis on market trends for this week, this month and this year, please check out my weekly MVA Investor Newsletter. The newsletter is published every Saturday and includes extended discussion of US and Indian stock markets, as well as gold, oil and major currencies.